
This mini plugin for WooCommerce adds a line graph to the single product page on the Inventory tab. The graph dynamically shows the changes in inventory levels over time per product.
The download folder includes 2 mini plugins.
The 1st image in the gallery uses Google Charts and the 2nd uses a custom script.
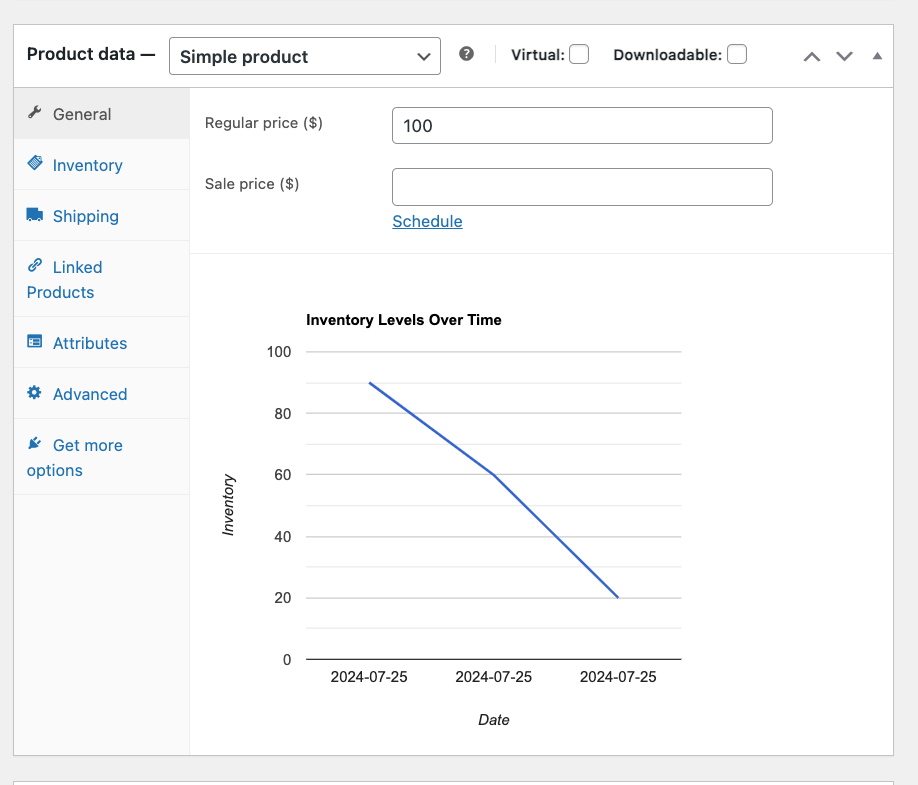
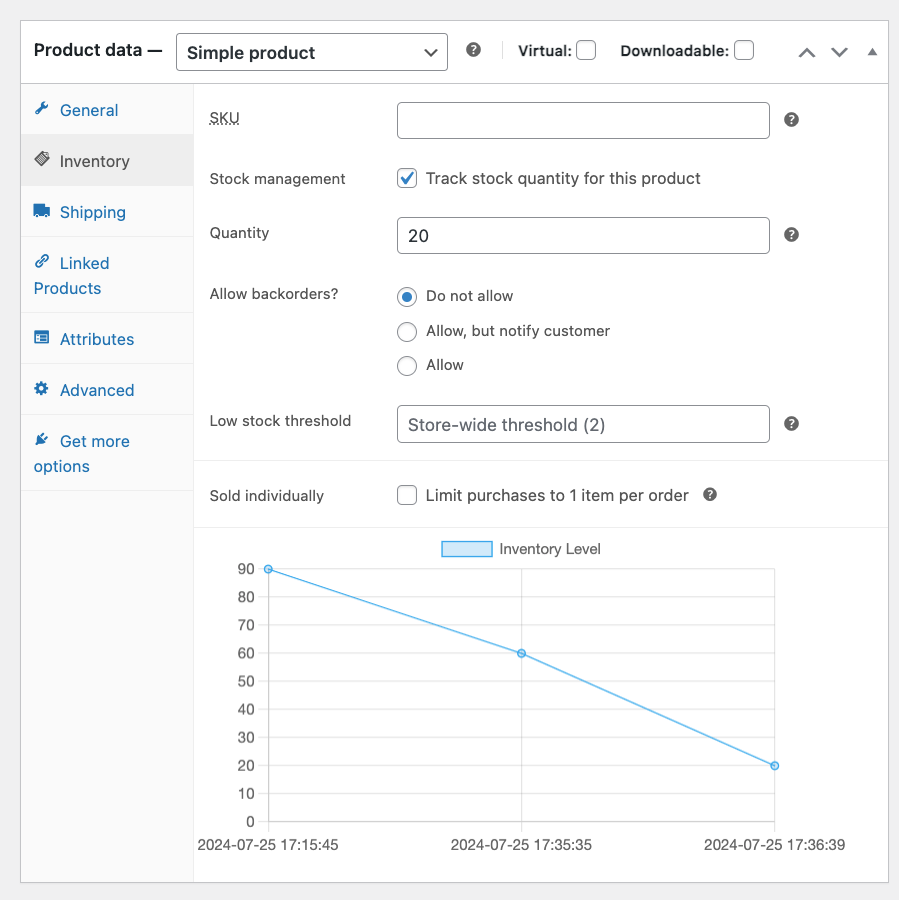
Both plugins include the date as well as the inventory levels pulled from your WooCommerce database.
The charts above are based on 3 sales totaling 70 units. Starting with an inventory level of 90 units, the current level is 20.
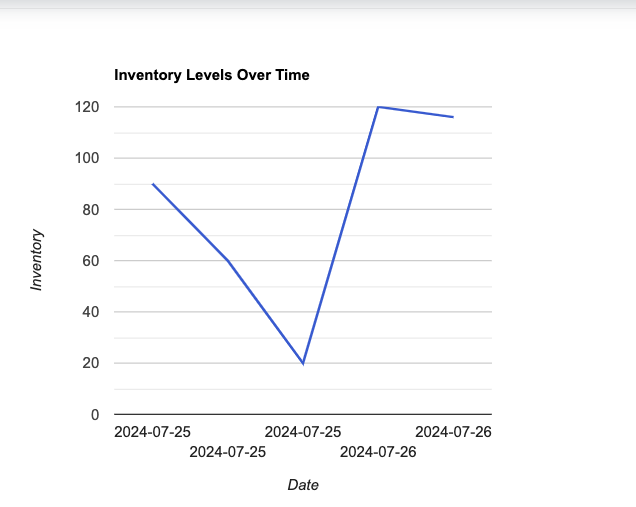
Stock Increases & Decreases
This chart shows 3 sales decreasing stock levels over 1 day and then a line on the next day when inventory was increased to 120 units before a sale for 4 units.
Note : Your inventory data starts saving and displaying from the time you install the plugin for a 6 month period. You can change the time period in the plugin.
Installation
Once click installation and your line graph will start to show a line on the graph as soon as inventory levels change.